Telecom networks produce an enormous amount of data every day. Cell towers, core network systems, billing platforms, and customer support logs each generate their own stream of information, and in most organizations, that information stays put. Network diagnostics live in one system, customer records live in another, and billing history sits somewhere else entirely.
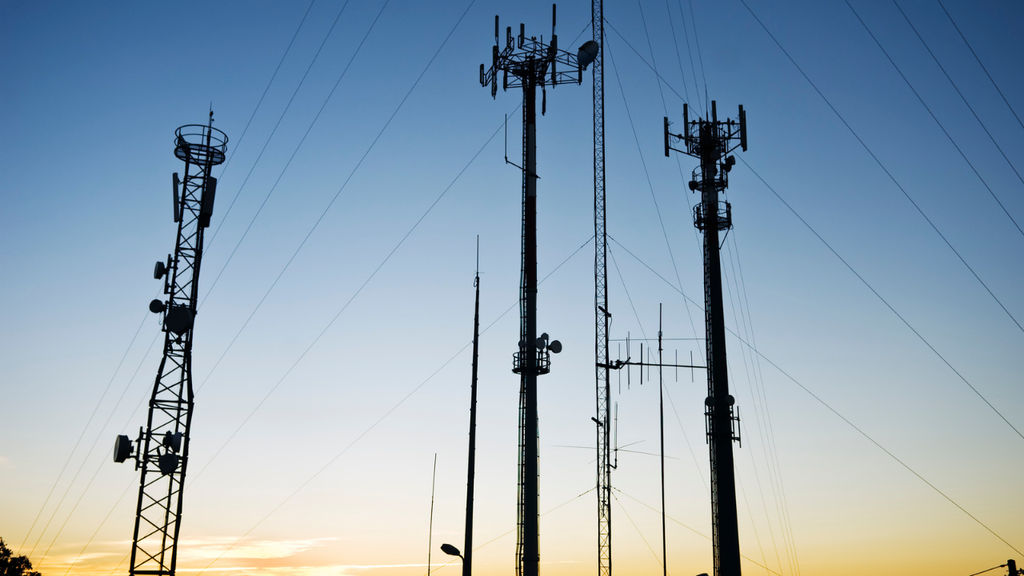
That separation is the real problem behind telecom data overload. It’s not that communications service providers lack data but that the data is scattered across disconnected systems, and by the time teams pull it together into a report, the moment to act on it has often passed.
Here’s what that looks like in practice. A regional cell tower starts experiencing latency, meaning the delay between a request and a response over the network gets longer than it should. Network engineers might not notice the pattern until they happen to pull a report at the end of the week.
Meanwhile, customers in that area are already noticing dropped calls and slow data, and some of them are calling support. Support doesn’t have visibility into the network issue, so they log the complaint as a one-off.
By the time anyone connects the tower problem to the spike in support calls, the affected customers have had a bad experience for days, and some of them have already started shopping for a new provider. That last part is what the industry calls churn: the rate at which customers cancel service.
In a market where winning a new subscriber costs far more than keeping one, unmanaged churn is where telecom data overload turns directly into lost revenue.
What Tableau (and Salesforce) Bring to Telecom Teams
Tableau is a data visualization and business intelligence tool. In plain terms, it takes the raw numbers sitting in different systems, whether that’s a network monitoring platform, a billing database, or a spreadsheet someone updates by hand, and turns them into charts and dashboards that update automatically as new data comes in.
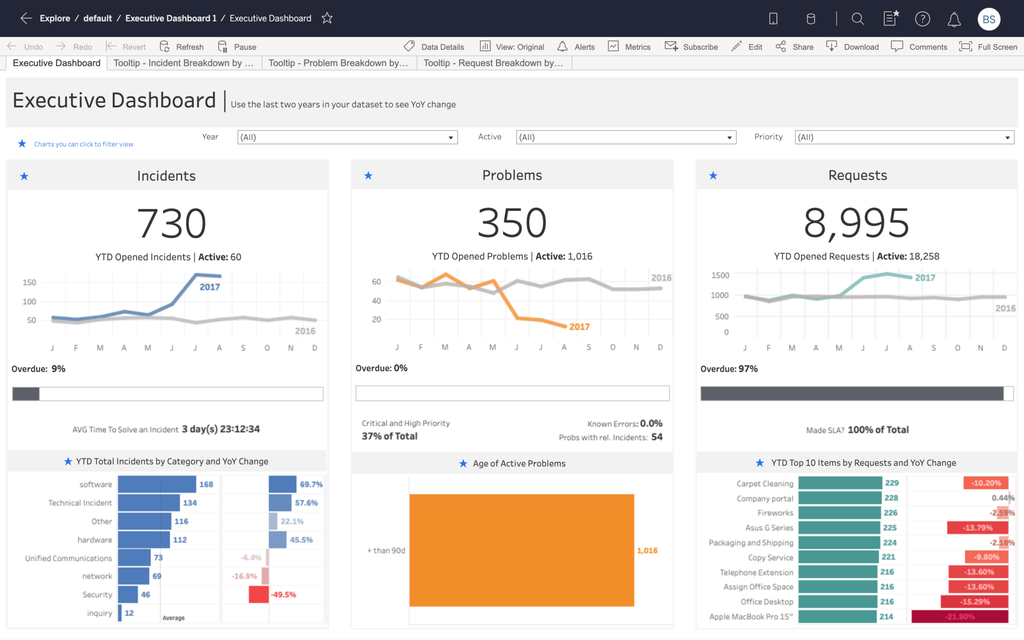
Source: https://www.tableau.com/solutions/support-and-service-analytics/dashboards
The goal is to remove the manual step where someone exports a report, copies it into Excel, and builds a chart by hand every week.
Tableau connects to those source systems directly, so the same dashboard that shows a network engineer today’s outage map can also pull in billing data for a finance dashboard down the hall, without anyone re-entering numbers.
Paired with Salesforce, including Agentforce Communications (formerly Communications Cloud), those dashboards can be embedded directly inside the tools that sales, service, and network teams already use every day. Embedded just means the dashboard shows up inside the application someone already has open, rather than living in a separate portal they have to remember to check.
Source: https://www.tableau.com/blog/tableau-pulse-and-tableau-ai
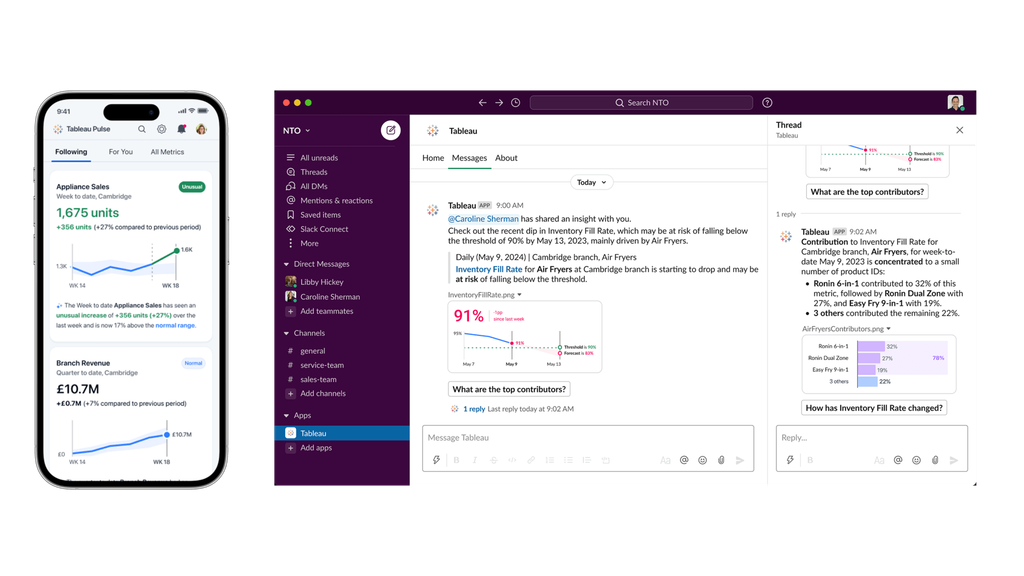
A newer piece of this is Tableau Pulse. Instead of waiting for someone to open a dashboard, Pulse works the other way: a team defines a metric they care about once, such as churn rate in a specific region or average call latency, and Pulse watches that metric daily. When it moves outside a normal range, Pulse sends a plain-language alert, through Slack, Teams, or email, describing what changed and by how much. For a telecom team, that might mean getting a message that says churn in the Southeast region rose 12 percent this week, before anyone had to go looking for it.
Real-World Uses of Tableau in Telecom
Network operations teams track outages, latency, and capacity across their footprint, often by region or by individual tower.
What the dashboard tracks
- Outages
- Latency
- Capacity
- By region or tower
Instead of pulling separate reports from separate systems, an engineer sees a map of the network with problem areas highlighted, along with the trend leading up to them.
A tower whose capacity has been climbing steadily for three weeks is a very different problem than one with a sudden spike. Seeing the difference lets a team fix the first before it becomes the second.
This is where connecting data sources pays off directly.
What a churn dashboard combines
- How the customer uses their service
- Network quality issues
- Recent support contact
Individually, none of those data points says much. Together, they let a team build a risk score: a simple ranking of which accounts are most likely to cancel, so a retention team can reach out before the customer decides to leave rather than after.
Drop in support call volume at Verizon after its analytics team combined call center, digital, and dispatch data into shared dashboards. Staff could see the root cause of a complaint instead of just the complaint itself.
Source: Tableau case studyFinance teams use the same kind of dashboards to track ARPU.
What the dashboard tracks
- ARPU by region
- ARPU by plan type
- Usage data
Watching ARPU trend alongside usage lets finance build forecasts based on what’s actually happening now, rather than working off last quarter’s spreadsheet.
Average revenue per user: simply the average amount of money each customer brings in over a given period.
Marketing and sales teams measure how a campaign performed against what it cost, and segment customers so offers can be targeted instead of blasted to everyone.
What the dashboard tracks
- Campaign performance vs. cost
- Segments by usage level
- Segments by plan type
Segmenting means grouping customers by shared traits, so each group gets the offer that fits it.
Subscribers whose anonymized mobility data Telia, the largest telecom provider in the Nordics, turned into a product it now sells to transit agencies and city planners. Network data became a new source of revenue, not just an internal reporting tool.
Source: Tableau case studyWhat Makes Tableau Effective for Telecom Teams
The reason Tableau works well in telecom isn’t the volume of data it can handle but how approachable the results are once a dashboard is built well.
A properly designed dashboard doesn’t require the person viewing it to know how to write a database query or understand how the underlying data is structured. A network engineer, a call center supervisor, and a CFO can each open a dashboard built specifically for their role and get an answer in the time it takes to look at a screen, instead of submitting a request and waiting on someone else to pull a report.
That combination of speed and clarity is what lets teams move from reviewing what already happened to making decisions in the moment, whether that’s rerouting traffic away from a congested tower this afternoon or flagging an at-risk account before the next billing cycle closes.
Common Roadblocks in Tableau Deployments
None of this happens automatically, and in our experience, most of the deployments that stall run into one of a few recurring problems.
-
If a system records a customer’s plan type one way and a second system records it slightly differently, a dashboard pulling from both will produce numbers that don’t match, and nobody trusts a dashboard they don’t believe.
-
Once a few teams start building their own dashboards, it’s common to end up with a dozen different views of “active customers,” each defined slightly differently by whoever built it. That’s a governance problem: without an agreed-upon definition for key terms and a process for who is allowed to publish a new dashboard, teams end up arguing about whose numbers are right instead of acting on the numbers.
-
A dashboard that works fine on a sample of a few thousand records can slow to a crawl once it’s pulling from the millions of records a real telecom network generates, if it wasn’t built with that scale in mind from the start.
Underneath most of these issues is the same root cause: a data model, meaning the underlying structure that defines how information from different systems relates to each other, that wasn't planned around how the dashboard would actually be used.
Best Practices for Telecom Tableau Deployments
The telecom teams that get the most out of Tableau tend to follow a similar approach. They centralize their data sources, meaning they route information through a smaller number of well-maintained connections instead of pointing a dozen dashboards directly at a dozen different systems, so a fix in one place doesn't require rebuilding everything downstream.
They design dashboards around a specific role rather than building one all-purpose view, so a network engineer and a regional VP aren't trying to find their answer in the same crowded screen.
They set governance standards early, meaning clear rules for who can publish a dashboard and how core terms like "active customer" or "churn" are defined, so those words mean the same thing in every report across the company.
And they invest in training so the people using these dashboards understand what they're looking at and why, not just which button opens the file.
How Vectr Solutions Helps Telecom Teams Succeed with Tableau
Vectr Solutions built our Business Intelligence and Analytics practice solving this same problem in industries where data is just as scattered and just as high-stakes: public sector agencies running multiple legacy systems, government contractors managing compliance-heavy reporting, and organizations operating inside Salesforce Government Cloud.
The technical challenge is the same one telecom teams face: disconnected systems, strict data handling requirements, and a real cost when the right information doesn't reach the right person in time.
That background shapes how we approach a telecom deployment. Our Tableau Cloud Implementation work starts by mapping out who actually needs to see what, then builds role-based dashboards around those answers, embedded directly into Salesforce.
Tableau Prep and Data Transformation is the step before that: cleaning up inconsistent records and connecting data from billing systems, network platforms, and CRMs so the dashboard is built on a data model that holds up, rather than papering over messy source data.
Through Data 360, we help centralize customer and operational data into a single foundation, so teams stop stitching together spreadsheet exports every week just to answer a basic question.
We also set up Tableau Pulse for teams that want proactive alerts instead of another dashboard to remember to check, and we help organizations still running CRM Analytics, Salesforce's native analytics tool, plan a transition to Tableau on a timeline that fits their business rather than a forced migration.
The organizations that get the most out of it are the ones that build the right foundation to reach it, term by term and system by system, rather than layering another dashboard on top of the same disconnected data.
Turn Your Telecom Data Into Real Business Insights
Telecom data holds valuable insights, but only if your team can access and act on it. With the right Salesforce and Tableau strategy, you can turn complex, scattered data into clear, actionable decisions.